Every reading in range, but operations are still slipping.
Most operations are watched one value at a time, each against its own limit. That catches a breakdown, but rarely the slow kind of trouble: a system that works a little harder every week to deliver the same result. The controller compensates, the limits stay green, and the cost turns up later on the energy bill, in lost capacity, or as an unplanned stop.
Twelve measurements, all within limits for nine weeks. One arc starts to move in week three.
- Measurement
- Value between its limits
- Arc
All values in range. One arc moving.
Illustration with simulated data.
How Starqh keeps you there
Connect.
Starqh reads the data your control system already records, so no new sensors are needed.
Learn the optimal state.
It learns how your measurements behave together when the operation runs well: which rise together, which balance each other. We call each of these connections an arc.
Flag the arc that moved.
When an arc shifts, Starqh shows you which one, since when, and what it connects. Every single value can still be in range at that point. You fix a small thing, on your schedule.
Under the hood: a graph neural network trained on your own history.
Where it fits
Any operation where many measurements depend on each other: cooling plants, logistics and sorting centres, data centres, hydropower, energy storage, vehicle fleets, ground movement, and more.
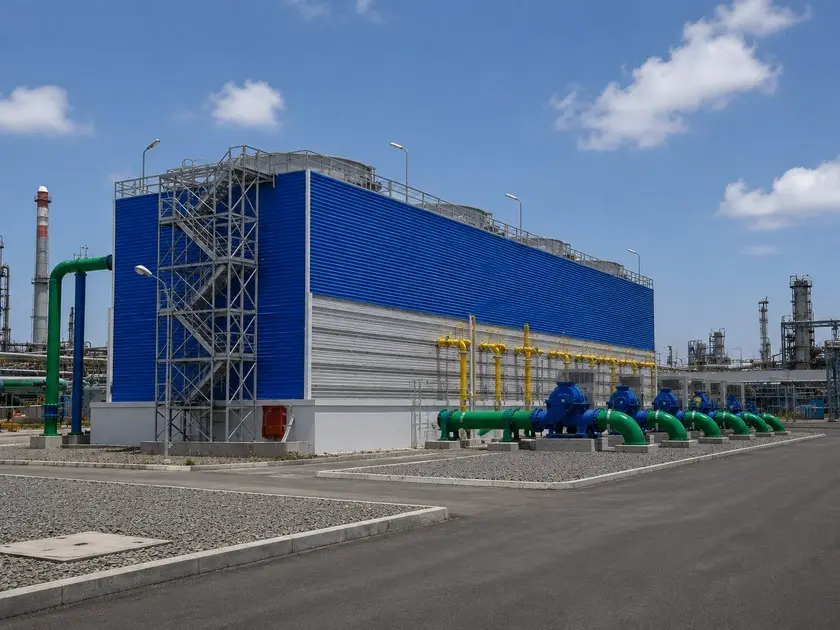
Cooling plants compressor power against room temperature and door openings 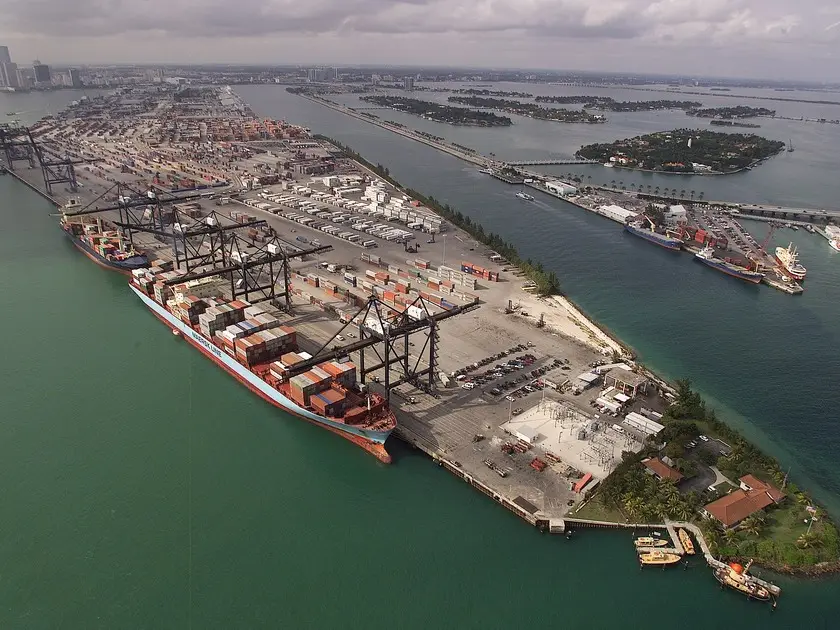
Logistics and sorting centres conveyor power against throughput 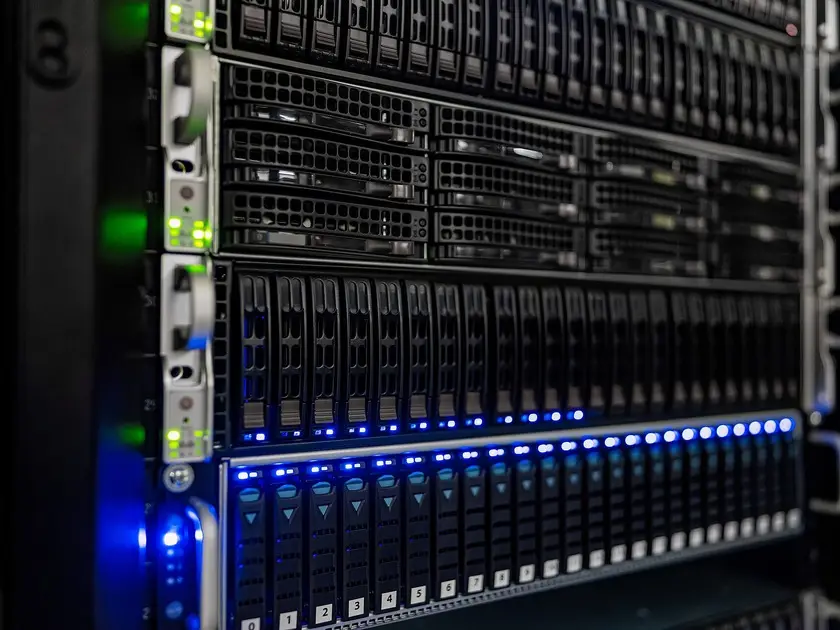
Data centres cooling power against IT load and outside temperature 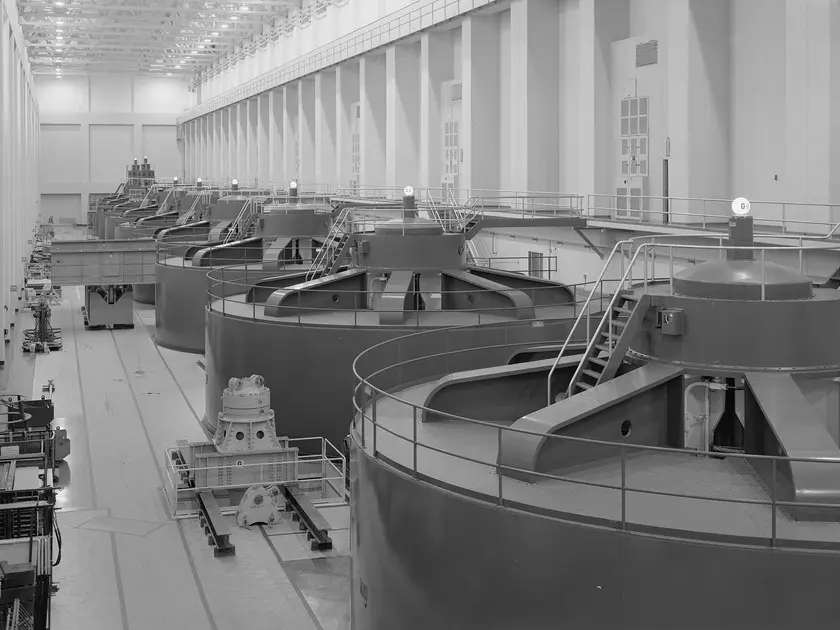
Hydropower output against head and flow 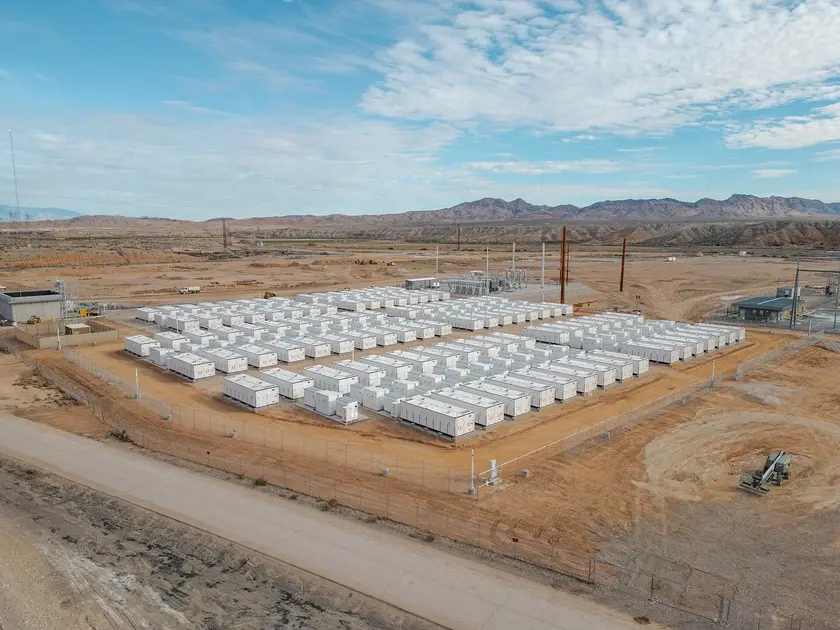
Energy storage energy accepted against temperature and cycle count 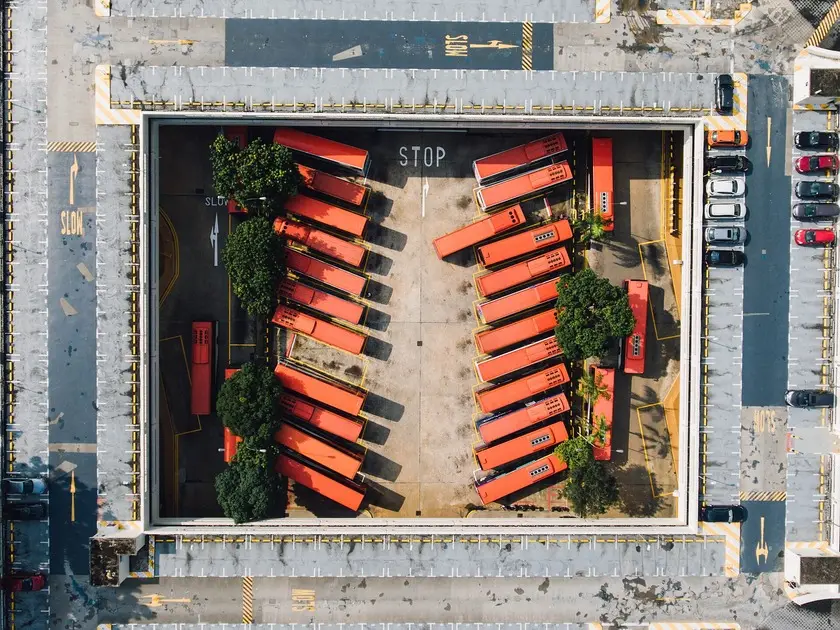
Vehicle fleets energy per kilometre against load and route 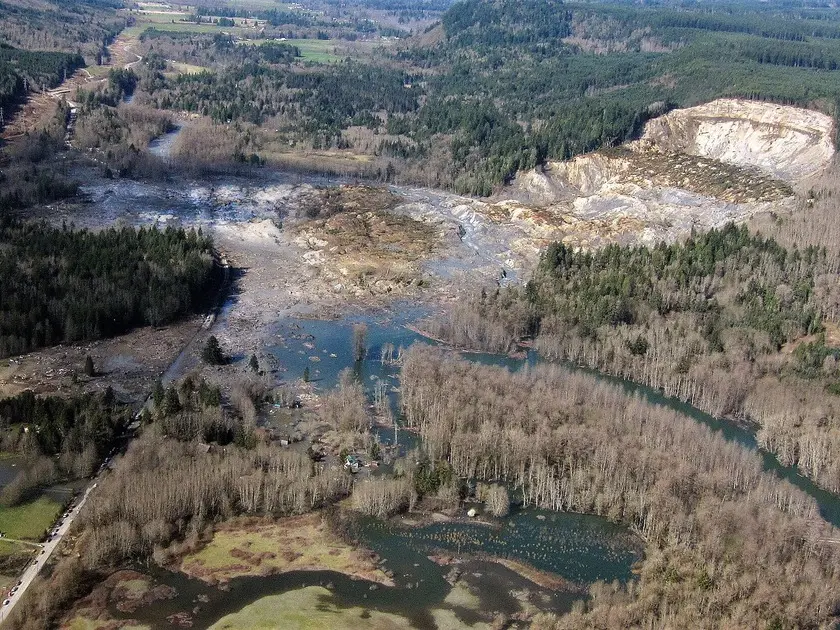
Ground movement surface displacement from satellite images against rainfall and groundwater level
Questions operators ask
Do we need new sensors?
No. Starqh works with the data your control system already records.
What data do you need?
A historical export of your measurements, the longer the better, so that the optimal state is learned across seasons.
How does a pilot work?
You export historical data, we learn the arcs and come back with the ones that moved. You tell us whether they were real.
Does it replace our alarms?
No. Your limits and alarms stay as they are. Starqh adds a view of how the measurements move together, so you hear about a shift before a limit is reached.
Where is our data stored?
On secure servers in the EU, or on Starqh's own cloud servers. Your data stays yours, is used for your model only and is never shared.
What do we get back?
A short list of the arcs that moved: what each one connects, since when, and how far. With each comes a plain-language suggestion of what to check or adjust, so the person on site can act on it without a data scientist.
See what's possible
We are continuously looking for operators who want to test Starqh on their own historical data and shape it with us.
A pilot needs nothing but an export of your historical data: no hardware and no changes to your operation.
Request a demo